


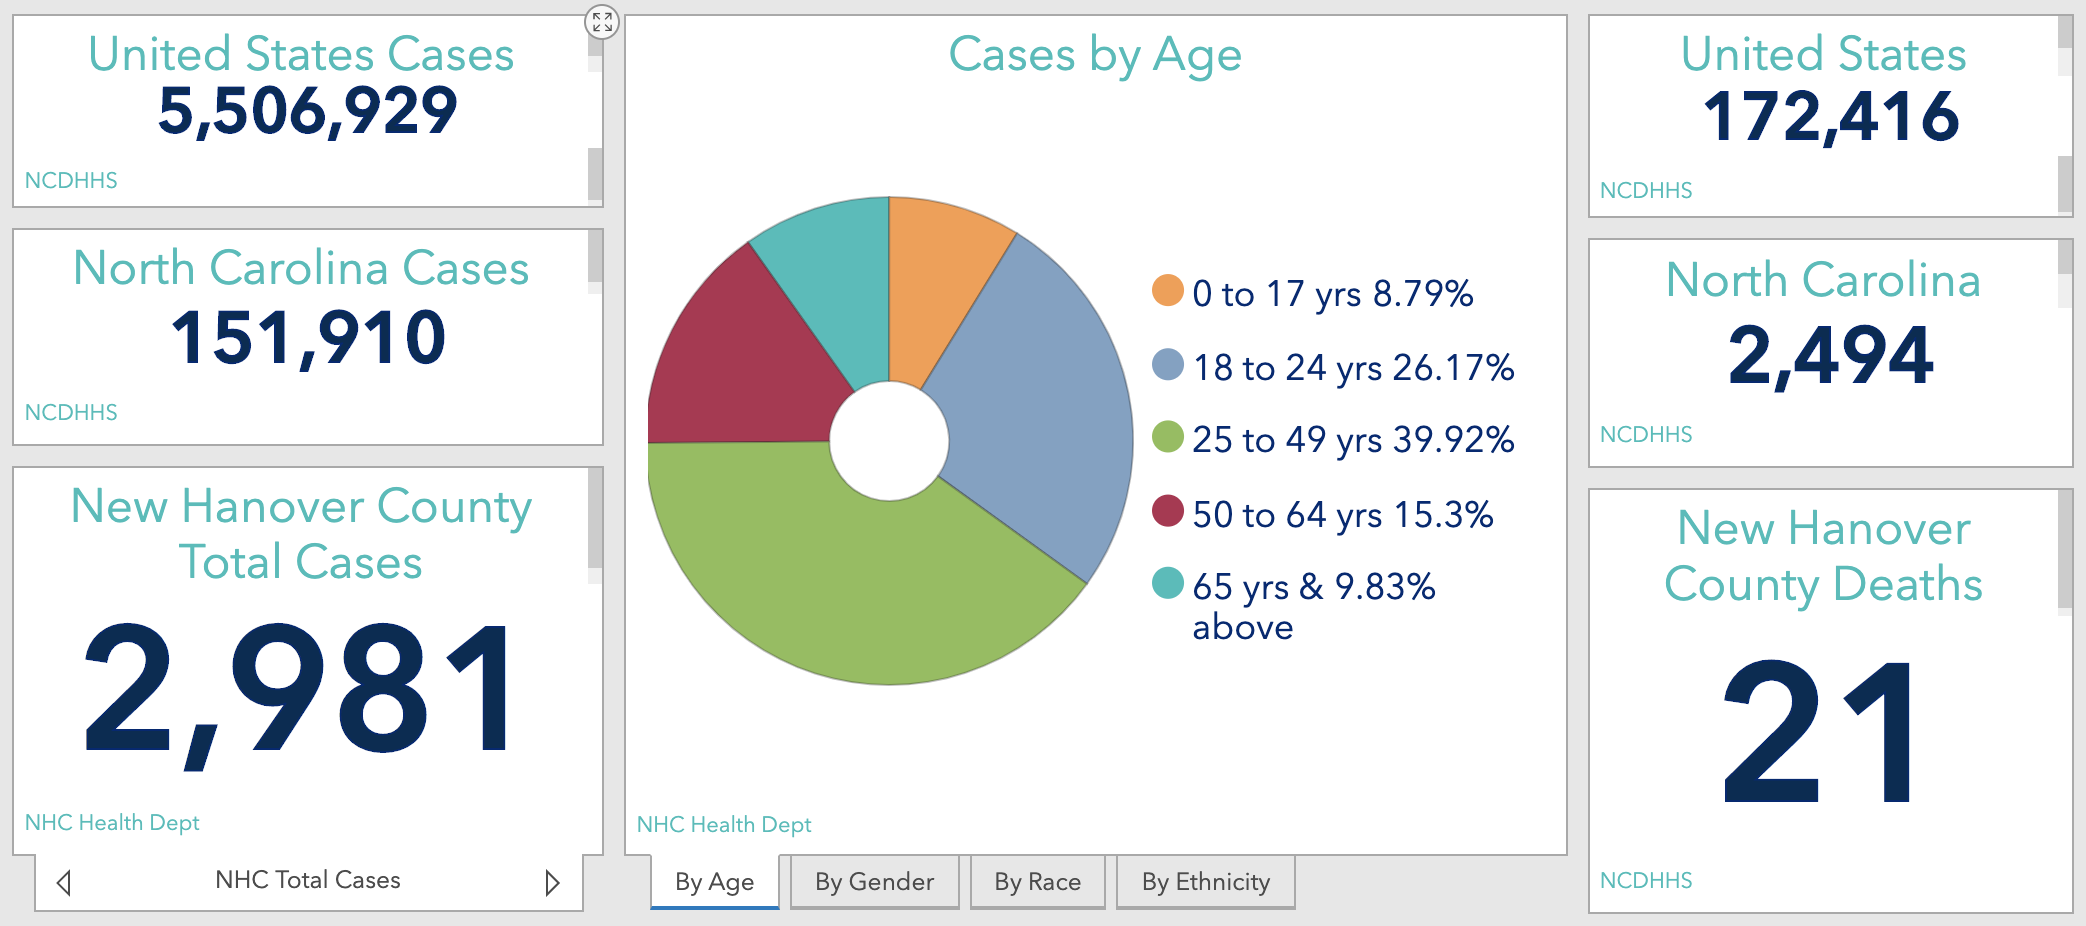
WILMINGTON — New Hanover County has designed a new Covid-19 dashboard to illustrate case numbers, deaths, and key demographic breakdowns of those who have tested positive for Covid-19 across the county.
The online dashboard is updated nightly, according to county officials, and its new trend graph shows what many have called a ‘flattening of the curve’ as the number of total positive cases begins to level off. No new cases of Covid-related deaths have been reported this week, as of Friday afternoon (a total of 21 county deaths has been reported since the pandemic, compared to 2,494 statewide deaths).
“Local data this week shows downward trends in lab-confirmed cases of COVID-19, outbreaks in congregate living settings and hospitalizations. These favorable trends could be attributed to more widespread adherence to the three Ws — Wear, Wait, Wash,” according to a release from the county.
RELATED: UNCW asks off-campus apartments to divulge names of students who gather, party in large groups
The dashboard shows two graphs — one measuring daily positive cases and the other showing cumulative case numbers — and a pie chart that breaks down the positive cases by age, gender, race, and ethnicity. It also shows state and national data, which the county hadn’t published before (it did provide a link to the state dashboard).
The county publishes other key data points like statewide hospitalizations here and outbreaks at congregate settings here. County health officials are monitoring seven outbreaks in congregate living settings, down from eight last week, according to the release.
“We are encouraged by the difference we are seeing in our local data, and the progress made by our community to protect one another, but it’s important to note when viewing the data that we are still seeing as many as 30 cases a day,” Public Health Assistant Director Carla Turner said.
Data points from the daily case chart shows that from Monday through Thursday of this week, there was an average of 28 cases per day — compared to an average of 59.25 daily cases over a Monday-Thursday stretch last month (July 20 through July 23). Demographic data for gender, ethnicity, and age, as of Friday afternoon, shows that 53.67% of the county’s positive cases have been found in females, 60.55% in white non-hispanic people, and 39.9% in people aged 25 to 64.
Turner encouraged residents to continue the progress in daily case numbers by following what health officials are calling the ‘three Ws’ — washing your hands, wearing face masks, and waiting six feet apart to avoid close contact — “especially as we look toward fall and the circulation of more common respiratory illnesses.”
“The better position we put ourselves and the community in now, the better positioned we will be later to respond to cold and flu season,” Turner said. “So keep wearing your mask, practice social distancing, wash your hands often, and make plans to get your flu shot.”
Jessica Loeper, the county’s chief communications officer, said the idea of a dashboard came several months ago when members of her office began talking to the county’s health and IT departments to work on a solution to reflect accurate and current data that is more efficient for staff to maintain and easier to use for the community.
“I think it will be good for our community to get quick glance of Covid-19 data in our area,” she said.
Send tips and comments to [email protected]
